Easily analyze your
Closely monitor your key financial indicators, measure your business performance over time, and assess the ROI of your prospecting campaigns.
Functionality included in all PLAN

")
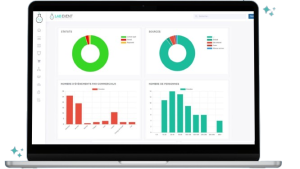
Financial statistics
Track your key financial indicators with precision and clarity.
✓ Display data based on specific dates or periods.
✓ Use various filters to refine your results.
✓ Benefit from diverse charts for improved performance visualization.
Quantitative statistics
Measure the evolution of your activity in terms of number of events and clients, for more refined and strategic management.
✓ Analyze the number of events generated over specific periods and by sales reps.
✓ Identify the channels generating the most demand: business providers, websites…
✓ Optimize team workload based on observed trends.
")
")
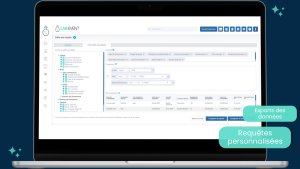
Sales Statistics
Closely track sales activities and use them to improve your lead generation process.
✓ Visualize all commercial activity of the company (calls, meetings, tasks, etc.).
✓ Evaluate the ROI of your prospecting campaigns.
✓ Export your data to Excel for deeper analysis and custom reports.
Optimize your management
with precise and detailed data analysis.
Schedule an appointment today to discover how Lab Event can transform your event management.
Explore all features
Data & analytics
No.1 software for professionals
in the event industry, used by over 500 clients.
[slide-anything id="19078"]