Get a clear and concise view of your key indicators from an intelligent dashboard.
Functionality included in all PLANS
")
Your KPIs and key figures in action with Lab Event
📊
measure
Access all your key indicators for complete and accurate visibility
📈
Compare
Analyze your performance over time and identify important trends
⚡
Optimise
Act quickly thanks to decision support tools and an integrated consistency check

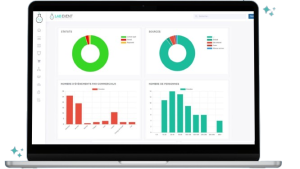
Measure your results accurately
Follow your performance in real time thanks to reliable and up-to-date indicators, directly linked to your events and quotes.
✓ An overview of your performance
✓ Detailed and targeted analyses
✓ Key indicators to guide your decisions (CA, event transformation rate, margins, average basket etc.)
Compare your performance over time
✓ Comparative curves by month and year on the signed CA HT
✓ Quick identification of peaks of activity or off-peak periods
✓ Analysis by client profile, project manager, main location, large families…


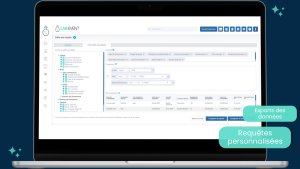
Optimize your actions
Thanks to dynamic filtering and actionable KPIs, adjust your strategic decisions and boost your profitability.
✓ Advanced filters for targeted and personalized analyses
✓ Decision support tool for salespeople, project managers or executives
✓ Consistency check included to ensure data reliability
Simply manage your KPIs and key figures with Lab Event
Schedule an appointment today to discover how Lab Event can transform your event management.
Explore all features
Data & analytics
No.1 software for professionals
in the event industry, used by over 500 clients.
[slide-anything id="19078"]